RICE Scoring
Reach × Impact × Confidence ÷ Effort, for prioritising features.
Prioritising a backlog with your product team.
A ranked list of ideas with scores.
Prioritise with a number, not the loudest voice
RICE is a prioritisation method created by product manager Sean McBride at Intercom (2016). You score each idea on Reach, Impact, Confidence and Effort, then calculate:
RICE score = (Reach × Impact × Confidence) ÷ Effort
It makes you think about each factor separately and compare very different ideas on one scale.
The four factors
Reach
Impact
Confidence
Effort
RICE calculator
Edit any value. The ranking updates as you type. Reach is per quarter; effort in person-months.
| Idea | Reach / qtr | Impact | Confidence | Effort (p-m) | Score | |
|---|---|---|---|---|---|---|
| 9,600 | ||||||
| 4,800 | ||||||
| 1,500 | ||||||
| 625 | ||||||
| 1,000 |
The chatbot vs. the status update
A fictional payments app team at “PayKaro” has five ideas and one quarter.
The loud idea
The quiet idea
Score them
Fictional example; numbers match the calculator's starting values.
Common mistakes
✓ Do
- Use the same time period for reach across all ideas
- Include all effort: design, engineering, QA, content
- Lower confidence when evidence is thin
- Use scores to start discussion, not end it
- Re-score when you learn more
✗ Avoid
- Inflating impact for pet projects
- Treating small score differences as meaningful
- Forgetting dependencies and strategy
- Scoring alone — do it with engineering and product
- Ignoring must-do work (legal, security) that doesn't fit RICE
RICE in one screen
SCORE = (REACH × IMPACT × CONFIDENCE) ÷ EFFORT

REACH       people/events per time period (e.g. per quarter)
IMPACT      3 massive · 2 high · 1 medium · 0.5 low · 0.25 minimal
CONFIDENCE  100% high · 80% medium · 50% low (below = moonshot)
EFFORT      person-months across all disciplines

TIPS  same time period for all · score as a team · re-score with new data
Figma template
A ready-made canvas for running this framework with your team. Free, editable, and it works in Figma and FigJam.
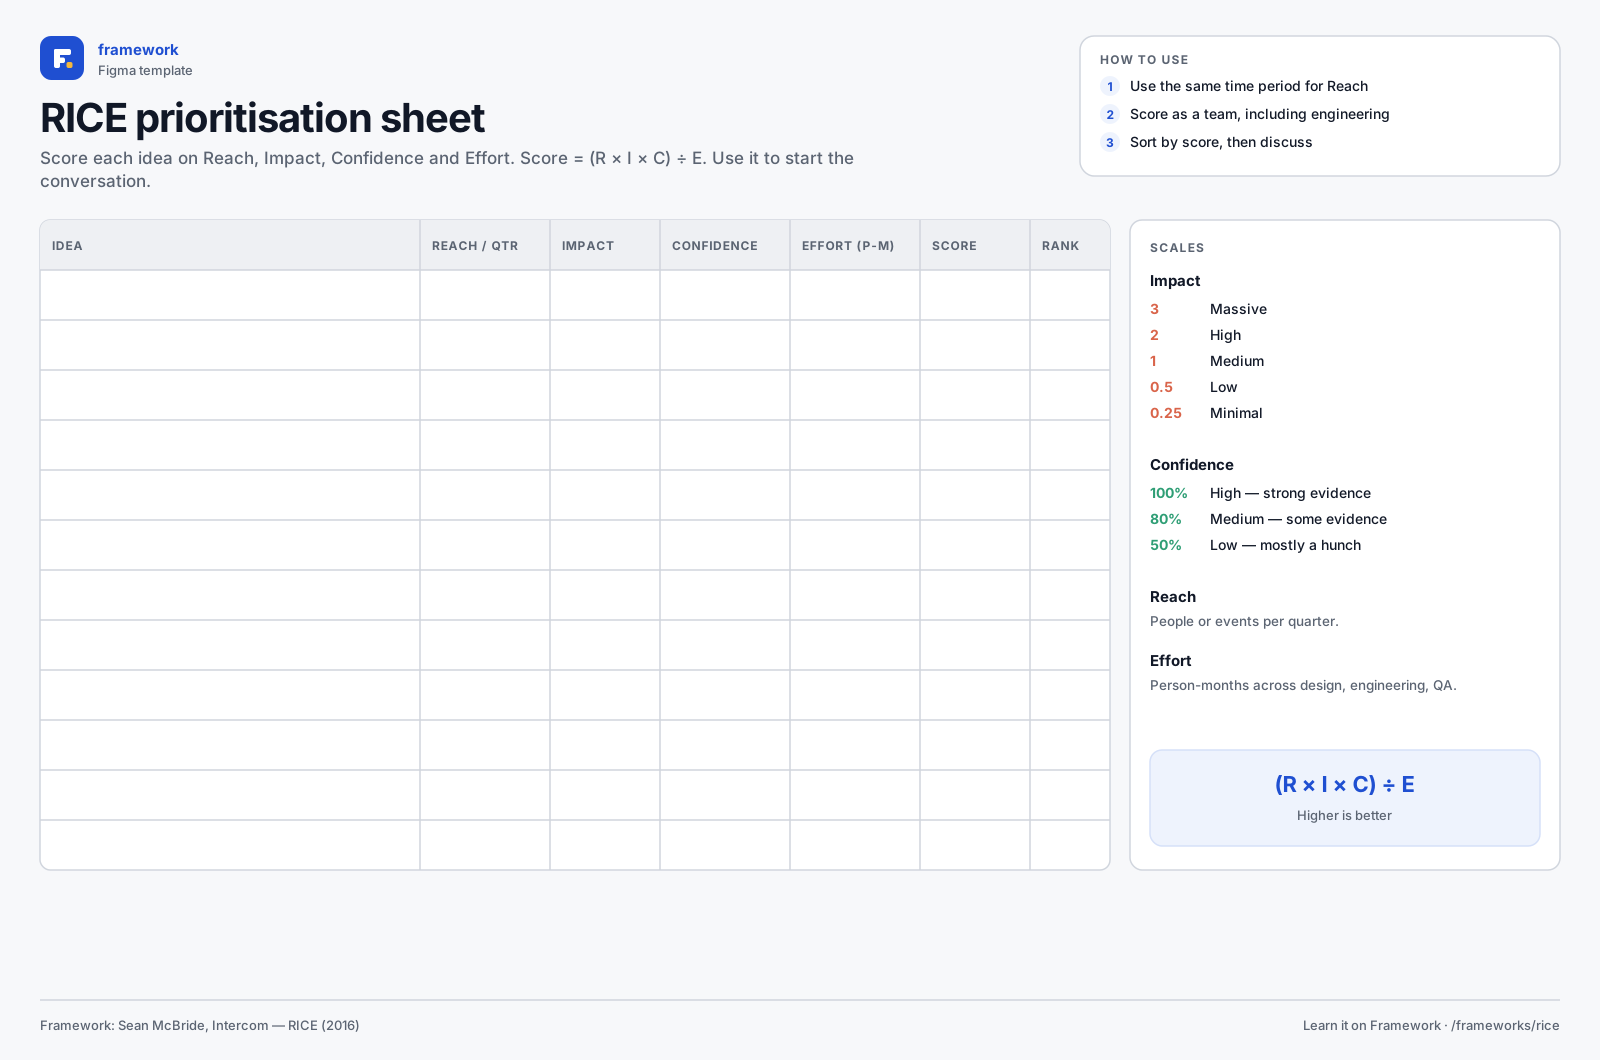
RICE prioritisation sheet
- Scoring table
- Reach, impact, confidence and effort scales
- 1Download the SVG, or copy it to your clipboard.
- 2In Figma or FigJam, drag the file onto the canvas — or paste with ⌘V / Ctrl V.
- 3Everything arrives as editable layers: type in the boxes, add stickies, duplicate rows.
Quick quiz
Get all three right to complete the lesson.
Notes are private and stored in this browser.
Sources and further reading
Related frameworks
AARRR Pirate Metrics
Acquisition, Activation, Retention, Referral, Revenue: the growth funnel.