HEART Metrics
Happiness, Engagement, Adoption, Retention, Task success: UX goals you can measure.
Defining how you'll know a design worked.
Goals, signals and metrics for each chosen category.
Turn “better UX” into numbers you can track
HEART is a framework from Google researchers Kerry Rodden, Hilary Hutchinson and Xin Fu, published in 2010. It gives teams five categories of user-centred metrics: Happiness, Engagement, Adoption, Retention, Task success.
It comes with a simple process — Goals → Signals → Metrics — so you measure what matters to users, not just what's easy to count, like page views.
Five categories
Happiness
Engagement
Adoption
Retention
Task success
Goals → Signals → Metrics
For each category you choose, work through three questions.
What do we want users to achieve or feel?
e.g. People know exactly when their food will arrive.
What would they do or say if we succeed?
e.g. They stop calling support to ask where the order is.
How do we measure the signal over time?
e.g. “Where is my order?” calls per 1,000 orders.
Measuring a live tracking map
A fictional food delivery app, “Thali”, launches a live map showing the rider and an updated ETA.
The feature
Pick the categories
Define goals, signals, metrics
Read the results
Fictional example; numbers are illustrative.
HEART builder
Tick the categories that matter, then edit the goal, signal and metric for your own feature. The example is filled in.
Common mistakes
✓ Do
- Start with goals, not with what's easy to measure
- Choose only the categories that fit
- Track trends over time, not one-off numbers
- Pair metrics with research to learn why
- Agree on metrics before launch
✗ Avoid
- Counting page views and calling it engagement
- Tracking all five for every tiny feature
- Metrics with no link to a user goal
- Celebrating adoption without checking retention
- Changing metrics after seeing results
HEART in one screen
H  HAPPINESS     attitudes: satisfaction, ease   → surveys, ratings
E  ENGAGEMENT    depth of use by existing users  → frequency, intensity
A  ADOPTION      new users of product/feature    → first use, sign-ups
R  RETENTION     users who come back             → repeat use, churn
T  TASK SUCCESS  effectiveness & efficiency      → completion, time, errors

FOR EACH CHOSEN CATEGORY
GOAL    what should users achieve or feel?
SIGNAL  what would they do/say if we succeed?
METRIC  how do we measure that over time?
Figma template
A ready-made canvas for running this framework with your team. Free, editable, and it works in Figma and FigJam.
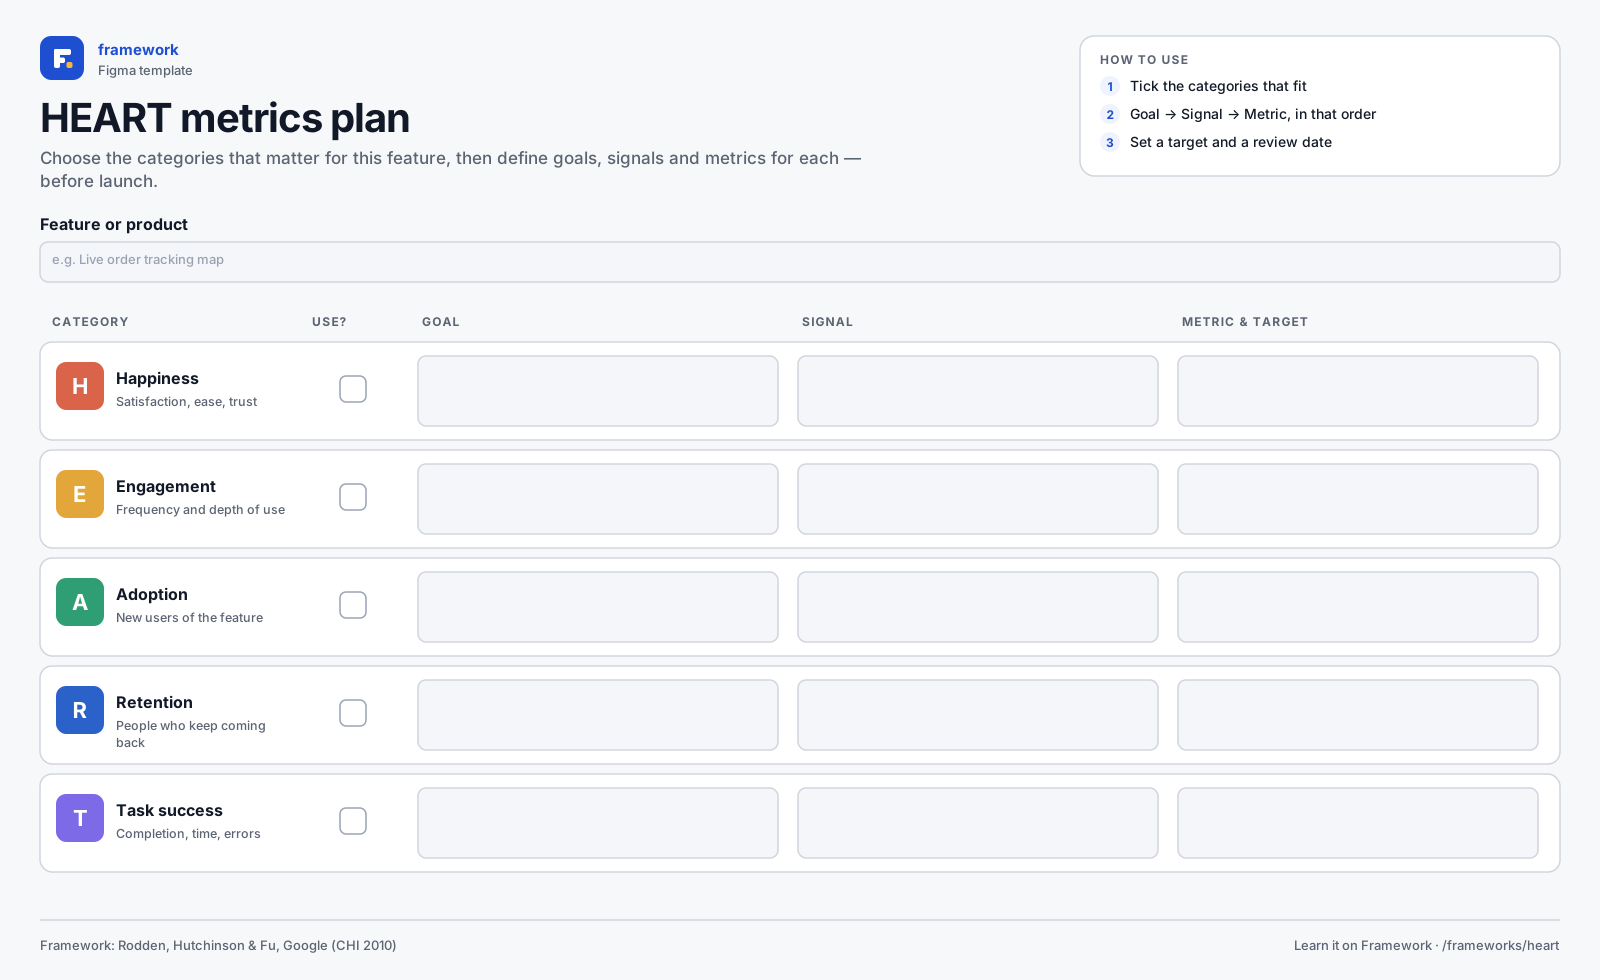
HEART metrics plan
- Goals → Signals → Metrics grid
- All five HEART categories
- 1Download the SVG, or copy it to your clipboard.
- 2In Figma or FigJam, drag the file onto the canvas — or paste with ⌘V / Ctrl V.
- 3Everything arrives as editable layers: type in the boxes, add stickies, duplicate rows.
Quick quiz
Get all three right to complete the lesson.
Notes are private and stored in this browser.
Sources and further reading
Related frameworks
RICE Scoring
Reach × Impact × Confidence ÷ Effort, for prioritising features.