Kano Model
Basic needs, performance features and delighters: know which features to build first.
Deciding which features will actually satisfy users.
Features sorted into must-be, performance and attractive.
Not all features make people equally happy
In 1984, Japanese professor Noriaki Kano showed that features affect satisfaction in different ways. Some only cause anger when missing. Some make people happier the more you add. Some delight even though nobody asked for them.
The Kano Model helps you decide what to build first: get the basics right, compete on performance, and add a few delighters.
Five categories
Must-be
Performance
Attractive
Indifferent
Reverse
The Kano chart
Across: how well a feature is implemented. Up: how satisfied people are. Drag the slider to see how each type reacts.
- Must-beUsers feel annoyed
- PerformanceUsers feel annoyed
- AttractiveUsers feel neutral
- IndifferentUsers feel neutral
At low implementation, a weak must-be causes the most frustration.
How a delighter becomes a basic
Ride-hailing apps show Kano's “natural decay” clearly.
Must-be
Performance
The delight of the map
Delight fades
Illustrative example of a well-known industry pattern.
Run a Kano survey
For each feature, ask two questions and pick the answer a typical user gave. The Kano table sorts it into a category.
| Feature | If it's there, you feel… | If it's missing, you feel… | Category |
|---|---|---|---|
| Must-be | |||
| Performance | |||
| Attractive | |||
| Attractive | |||
| Indifferent |
In a real study, ask 15–30+ users and take the most common category for each feature.
Common mistakes
✓ Do
- Fix broken must-bes before anything else
- Compete on one or two performance features
- Add a small number of real delighters
- Re-check categories every year or two — they decay
- Survey different user segments separately
✗ Avoid
- Spending effort on delighters while basics fail
- Asking “would you like X?” — everyone says yes
- Treating categories as permanent
- Mixing very different users into one result
- Building indifferent features because a stakeholder likes them
Kano Model in one screen
CATEGORIES
MUST-BE      expected · missing = angry · present = no praise
PERFORMANCE  more is better · linear
ATTRACTIVE   unexpected delight · missing = no problem
INDIFFERENT  nobody cares
REVERSE      some people don't want it

SURVEY  Q1 functional:    "If the product has X, how do you feel?"
        Q2 dysfunctional: "If it does NOT have X, how do you feel?"
        answers: like · expect · neutral · live with · dislike

EVALUATION (functional row × dysfunctional column)
           like expect neutral livewith dislike
like        Q    A      A       A        O
expect      R    I      I       I        M
neutral     R    I      I       I        M
live with   R    I      I       I        M
dislike     R    R      R       R        Q

PRIORITY must-be → performance → attractiveFigma template
A ready-made canvas for running this framework with your team. Free, editable, and it works in Figma and FigJam.
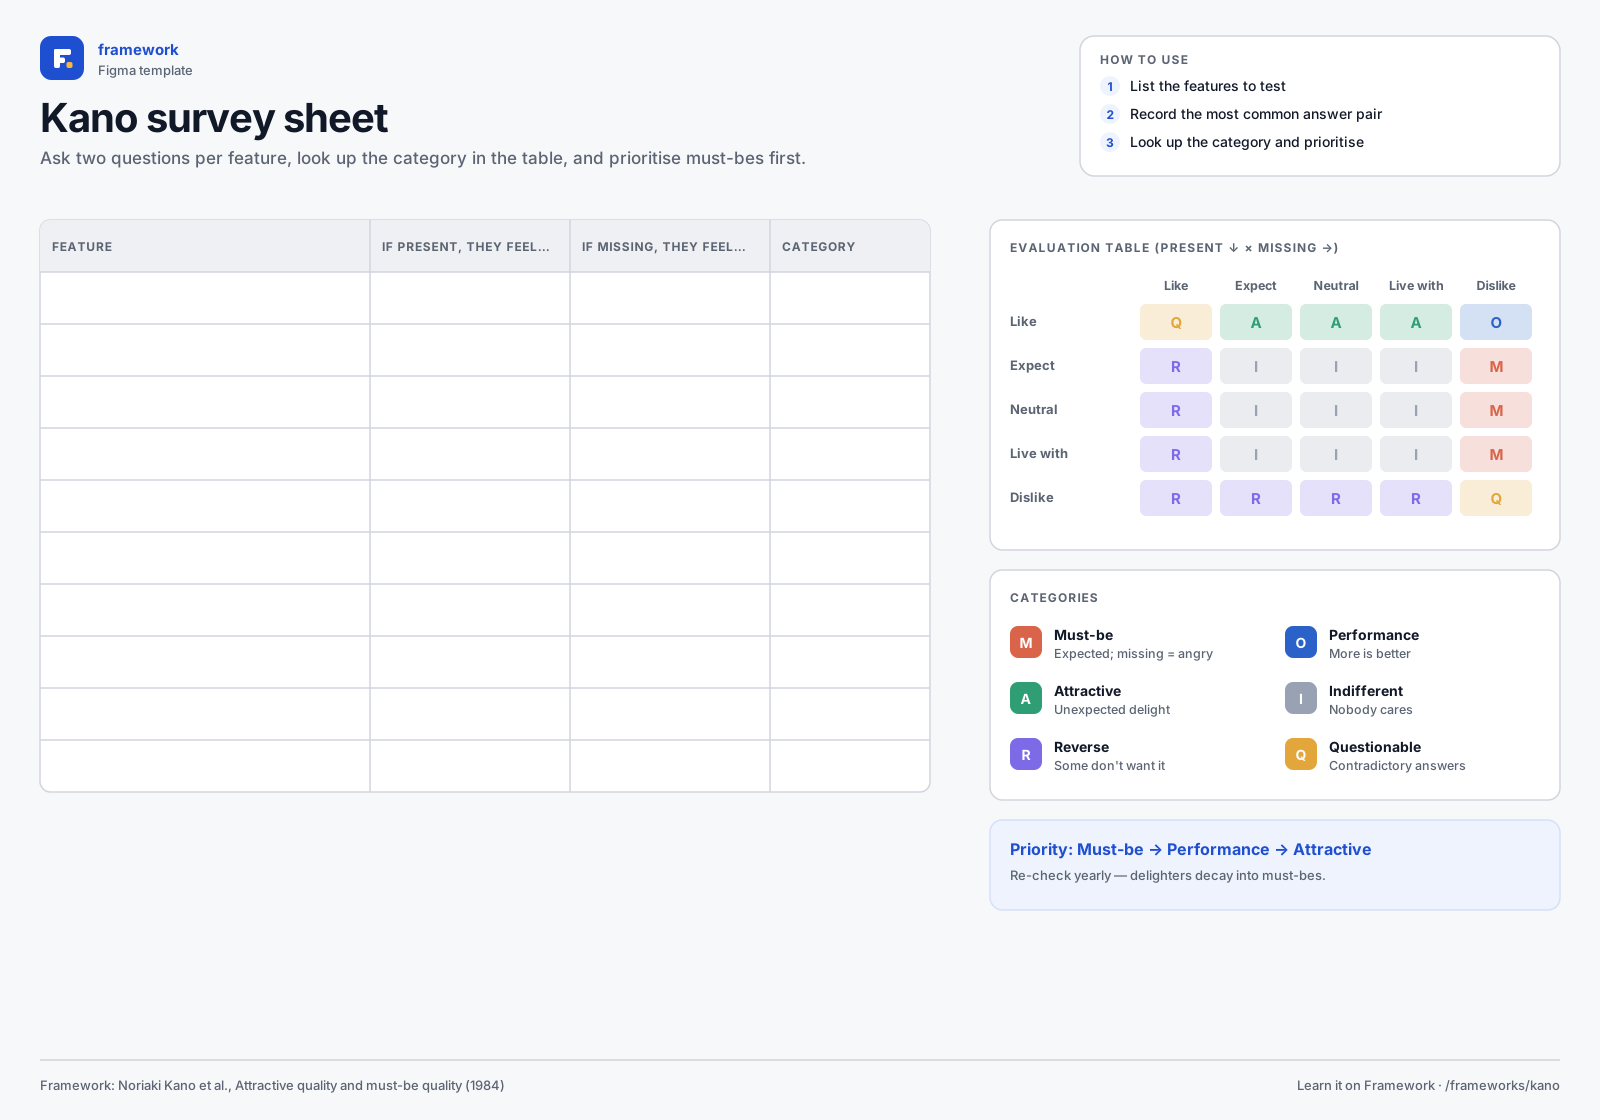
Kano survey sheet
- Paired-question sheet
- Evaluation table
- Categories and priority
- 1Download the SVG, or copy it to your clipboard.
- 2In Figma or FigJam, drag the file onto the canvas — or paste with ⌘V / Ctrl V.
- 3Everything arrives as editable layers: type in the boxes, add stickies, duplicate rows.
Quick quiz
Get all three right to complete the lesson.
Notes are private and stored in this browser.
Sources and further reading
- Kano, Seraku, Takahashi & Tsuji — Attractive quality and must-be quality (1984)
- Folding Burritos — The Complete Guide to the Kano Model
Related frameworks
HEART Metrics
Happiness, Engagement, Adoption, Retention, Task success: UX goals you can measure.