AARRR Pirate Metrics
Acquisition, Activation, Retention, Referral, Revenue: the growth funnel.
Finding where users drop off and what to design next.
A funnel with the biggest drop and design levers.
Five stages every product's growth goes through
In 2007, investor Dave McClure gave a talk called “Startup Metrics for Pirates”. He grouped the metrics that matter into five stages: Acquisition, Activation, Retention, Referral, Revenue — AARRR, which sounds like a pirate.
For designers, AARRR shows where in the journey your work has the most effect — and which metric to watch. Onboarding moves Activation. Habit design moves Retention.
Five stages
Acquisition
Metrics: Visitors, installs, sign-up page views
Activation
Metrics: % who reach the first “aha” moment
Retention
Metrics: Day-7 / day-30 return rate, repeat purchases
Referral
Metrics: Invites sent, % of new users from referrals
Revenue
Metrics: Conversion to paid, average order value
Funnel calculator
Enter the number of people at each stage for one month. The biggest drop is highlighted — that's where to focus.
Revenue % is shown relative to retained users.
One famous example per stage
Real stories often used to teach each stage.
Activation: Facebook's “7 friends in 10 days”
Retention: the flattening curve
Referral: Dropbox
Revenue: freemium upgrade
Summaries of widely told industry stories; screens are simplified illustrations.
Common mistakes
✓ Do
- Define activation as a specific “aha” moment
- Fix retention before spending more on acquisition
- Look at the stage with the biggest drop
- Measure by cohort (users who joined the same week)
- Design referral into moments of delight
✗ Avoid
- Counting sign-ups as success
- Vanity metrics like total downloads
- Optimising one stage and breaking another
- Referral prompts before users get any value
- Dark patterns in revenue (hidden fees, hard-to-cancel)
AARRR in one screen
ACQUISITION  how people find you        → visitors, installs
ACTIVATION   first great experience     → % reaching the "aha" moment
RETENTION    they come back             → D7/D30 return, repeat use
REFERRAL     they tell others           → invites, % new from referrals
REVENUE      they pay                   → conversion, order value

FOCUS  the stage with the biggest drop · retention before acquisition
DESIGN LEVERS  landing pages · onboarding · habits · share moments · pricing
Figma template
A ready-made canvas for running this framework with your team. Free, editable, and it works in Figma and FigJam.
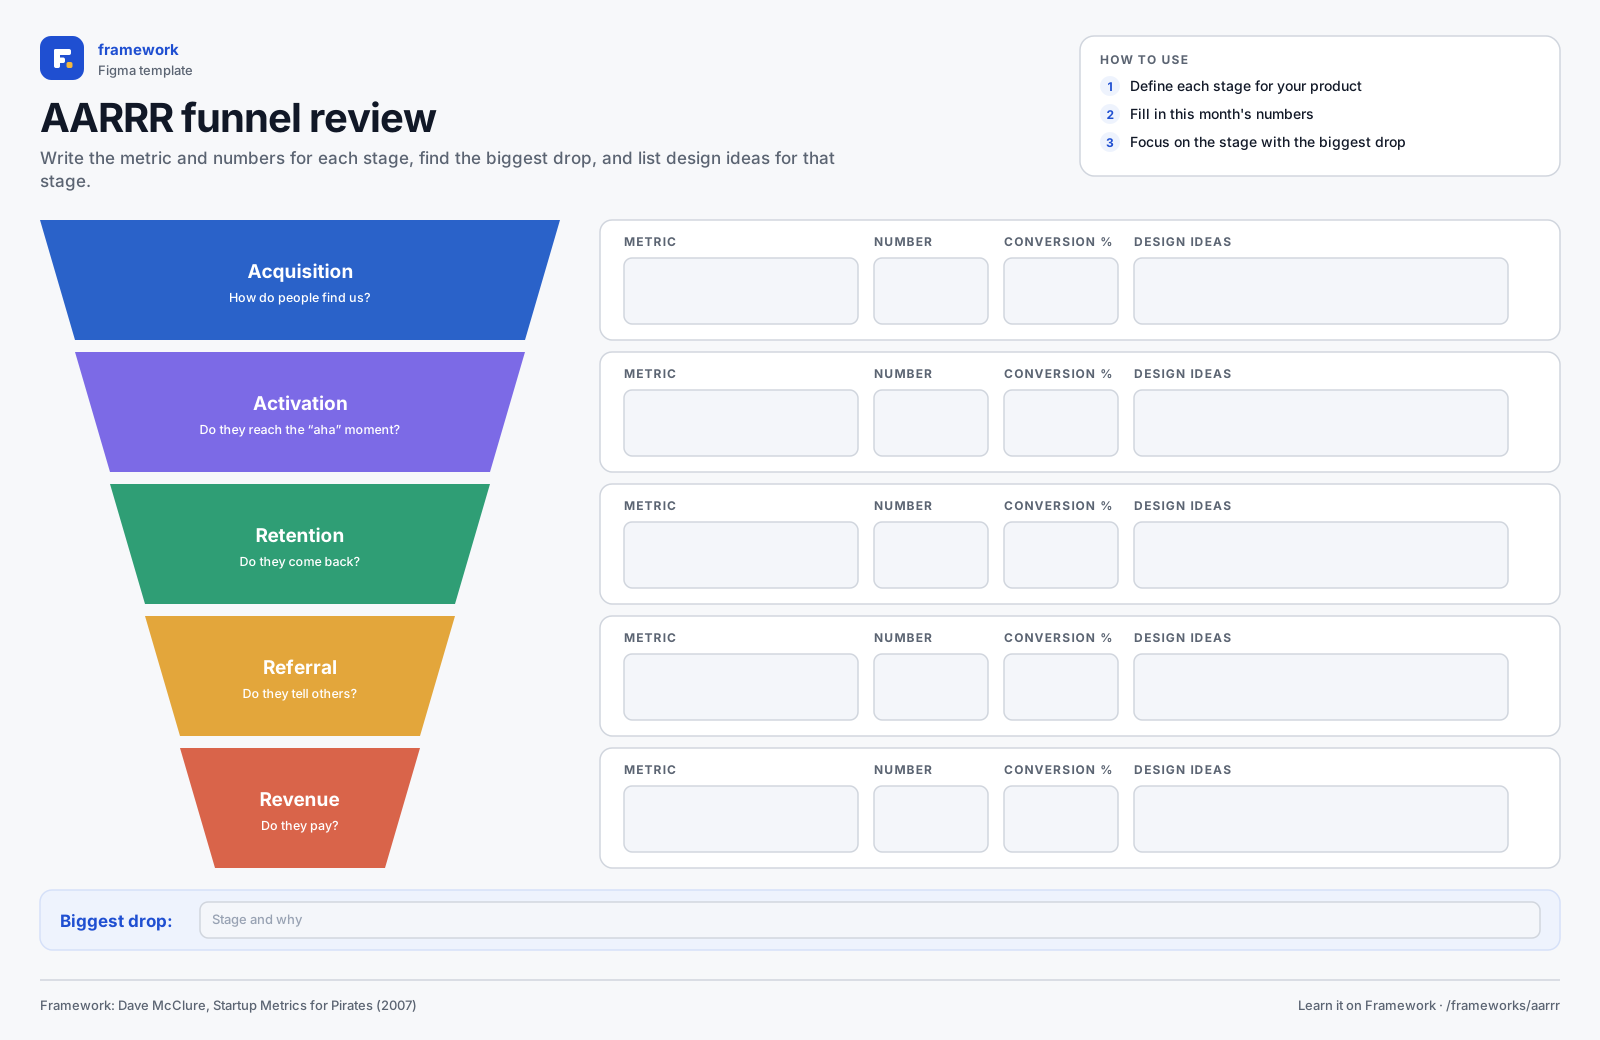
AARRR funnel review
- Five-stage funnel
- Metrics and conversion per stage
- Biggest drop
- 1Download the SVG, or copy it to your clipboard.
- 2In Figma or FigJam, drag the file onto the canvas — or paste with ⌘V / Ctrl V.
- 3Everything arrives as editable layers: type in the boxes, add stickies, duplicate rows.
Quick quiz
Get all three right to complete the lesson.
Notes are private and stored in this browser.
Sources and further reading
Related frameworks
Opportunity Solution Tree
Connect a business outcome to user opportunities, solutions and experiments.