Customer Journey Map
Every step a user takes, with their goals, feelings and pain points along the way.
Seeing the whole experience, including steps outside your product.
A journey map with an emotion curve and prioritised opportunities.
See the whole experience, not just your screens
A customer journey map shows every step a person goes through to reach a goal — including steps outside your product — along with what they do, think and feel at each one.
It grew out of service design and customer-experience practice. Teams use it to find where people struggle, and to align design, product, operations and support around one shared picture.
Anatomy of a journey map
Read it left to right (stages), top to bottom (lanes).
Persona and goal
Stages
Actions and touchpoints
Thoughts and emotions
Pain points
Opportunities
An interactive journey map
A food delivery journey. Select a stage to see its details, and drag its emotion slider to reshape the curve.
Receive order
Opens the bag: food is cold, raita missing
Doorstep
Thinking“I paid for this and it's cold?”
Cold food, missing item
OpportunityEasy refund for missing items in two taps
How a team builds a journey map
A fictional team at “Thali”, a food delivery app, maps the dinner-order journey.
Pick a persona and scope
Research the real journey
Map stages and lanes
Draw the emotion curve
Turn pains into opportunities
Thali is a fictional app. Example made for teaching.
Common mistakes
✓ Do
- Base it on research, not internal opinions
- Include steps outside your product
- Keep one persona and one goal per map
- Pair every pain point with an opportunity
- Put it on the wall and revisit it
✗ Avoid
- Mapping your funnel instead of the customer's experience
- Only showing happy paths
- Maps so detailed nobody reads them
- Making it once and never updating it
- Ignoring backstage causes of frontstage pain
Journey Map in one screen
PERSONA + GOAL + SCOPE (start → end)

LANES (top to bottom)
  stages · actions · touchpoints · thoughts · emotion curve · pain points · opportunities

PROCESS
1. Choose persona, goal and scope
2. Research: interviews, support logs, analytics
3. Map stages and lanes with sticky notes
4. Draw the emotion curve
5. Mark pains → write opportunities
6. Design the future-state journey and test it

TYPES  current-state · future-state · day-in-the-life · service blueprint
Figma template
A ready-made canvas for running this framework with your team. Free, editable, and it works in Figma and FigJam.
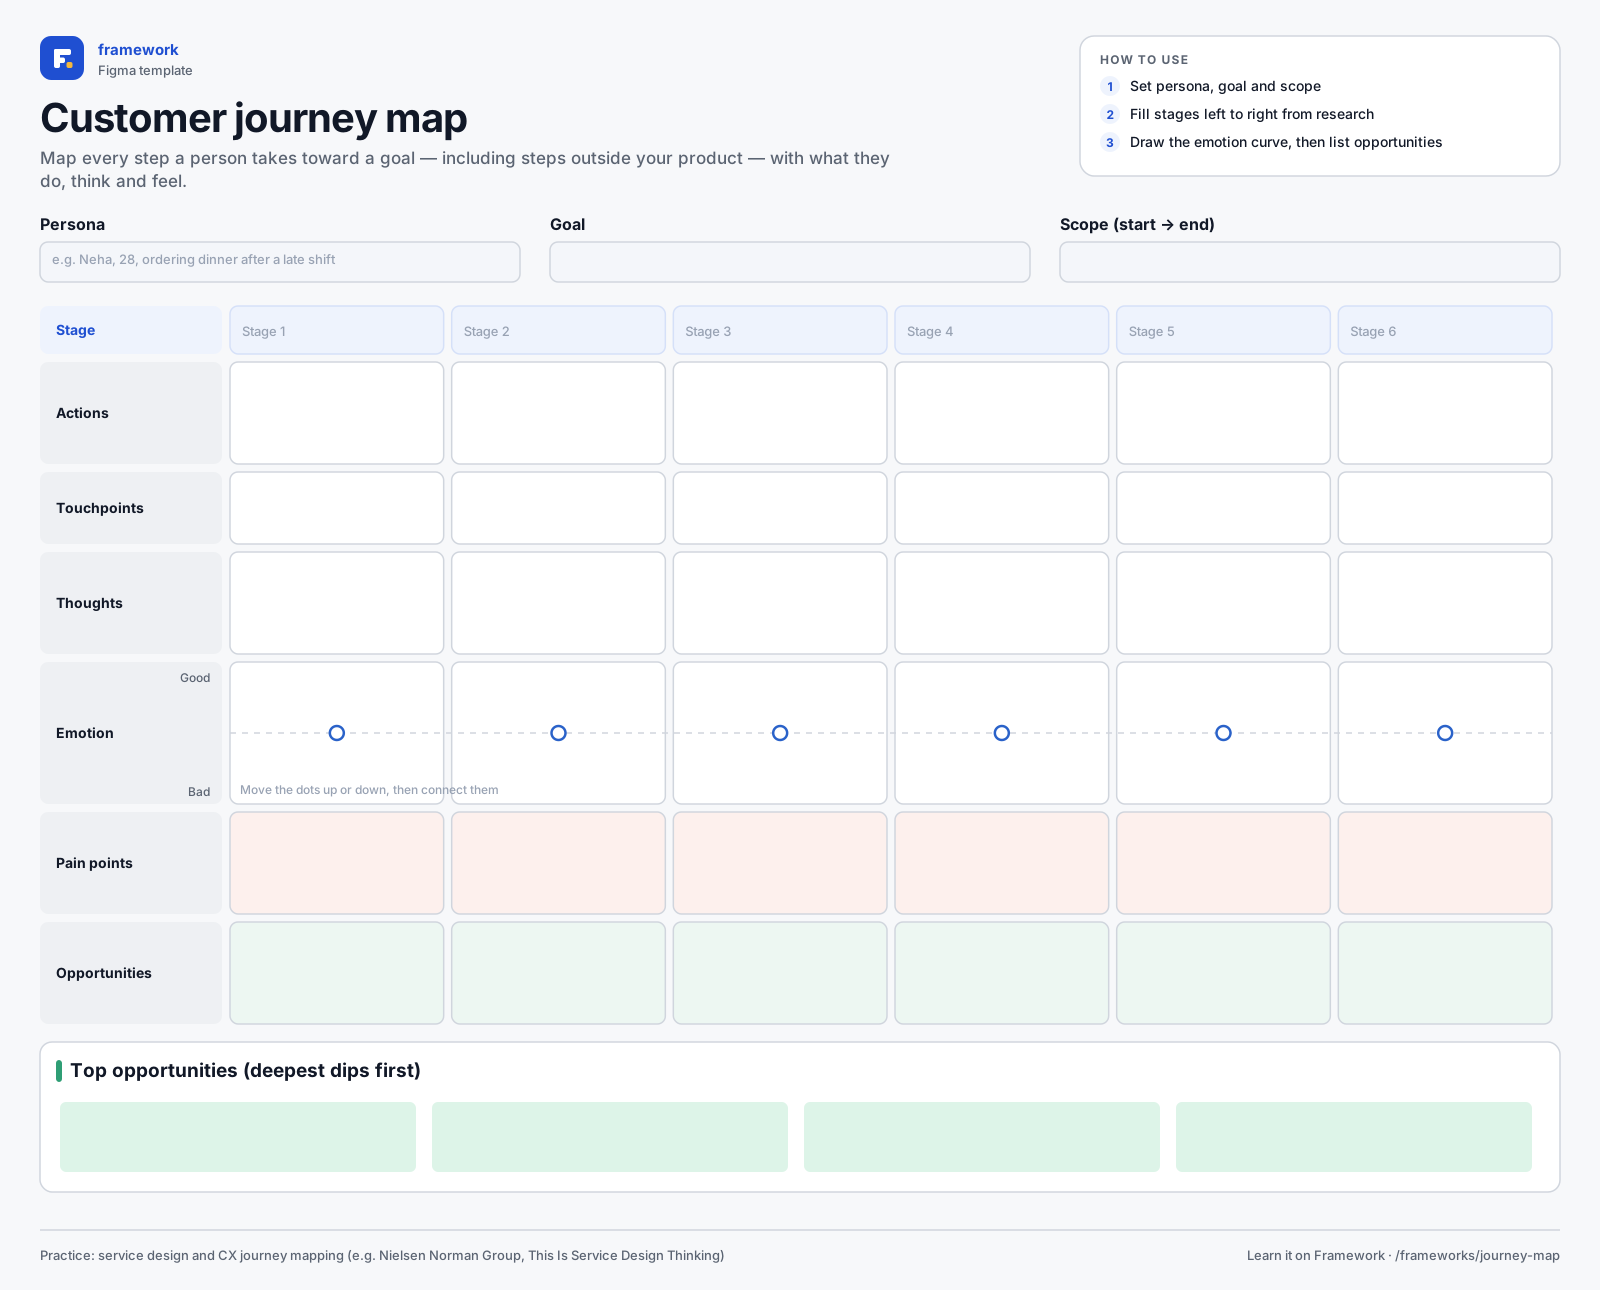
Customer journey map
- Stages × lanes grid
- Emotion curve
- Pain points
- Top opportunities
- 1Download the SVG, or copy it to your clipboard.
- 2In Figma or FigJam, drag the file onto the canvas — or paste with ⌘V / Ctrl V.
- 3Everything arrives as editable layers: type in the boxes, add stickies, duplicate rows.
Quick quiz
Get all three right to complete the lesson.
Notes are private and stored in this browser.
Sources and further reading
- Nielsen Norman Group — Journey Mapping 101
- Stickdorn & Schneider — This Is Service Design Thinking (2011)
Related frameworks
Nielsen's 10 Heuristics
Ten rules of thumb to find usability problems in any interface, fast.